Market Outlook
September 28, 2016
Market Cues
Domestic Indices
Chg (%)
(Pts)
(Close)
Indian markets are likely to open on a negative note considering global cues.
BSE Sensex
(0.2)
(71)
28,224
Nifty
(0.2)
(17)
8,706
After a fluctuating start of the day, US markets moved higher towards the end of the
Mid Cap
0.1
15
13,276
day offsetting losses in the previous sessions. Sentiment improved as US consumer
Small Cap
0.1
17
12,904
confidence index jumped to 104.1 in September vs. 101.8 in August showing an
unexpected improvement in U.S. consumer confidence in September. The traders
Bankex
(0.5)
(106)
22,292
were also digesting last night's first presidential debate which did not seem to feature
any substantial blows. Recent polls have shown any clear favourite to win the
Global Indices
Chg (%)
(Pts)
(Close)
election hence uncertainty about the outcome of the election remains.
Dow Jones
0.7
133
18,228
The U.K. indices finished lower, as bank shares dropped. The FTSE 100 index
Nasdaq
0.9
48
5,306
declined in the earlier sessions but managed to regain some lost ground towards the
FTSE
(0.2)
(10)
6,808
end of the day and closed at 6,808 over better US economic. The uncertainty on the
Nikkei
0.8
139
16,684
oil prices however persisted on Tuesday as major oil producers appeared to throw
Hang Seng
1.1
254
23,572
cold water on the prospect of a cap in production that might stabilize crude futures.
Overall UK and European shares were seen depressed due to concerns surrounding
Shanghai Com
0.6
18
2,998
the financial sector and pressure on VW shares.
Advances / Declines
BSE
NSE
Indian market extended their losses for third straight day despite opening the day on
a positive note. Amid the selling pressure, Sensex lost 70.58 points to close at
Advances
1,236
687
28224 while Nifty 50 index settled 16.65 points down at 8706.
Declines
1,463
928
Unchanged
217
78
News Analysis
Moody’s upgrades Tata Motors on JLR boost, strong domestic operations
RCom to trim debt by 75% in 12 months
Volumes (` Cr)
Detailed analysis on Pg2
BSE
2,890
NSE
19,094
Investor’s Ready Reckoner
Key Domestic & Global Indicators
Net Inflows (` Cr)
Net
Mtd
Ytd
Stock Watch: Latest investment recommendations on 150+ stocks
FII
(144)
4,329
44,997
Refer Pg5 onwards
MFs
196
1,166
11,275
Top Picks
CMP
Target
Upside
Company
Sector
Rating
(`)
(`)
(%)
Top Gainers
Price (`)
Chg (%)
Amara Raja Batteries Auto & Auto Ancillary
Buy
1,012
1,174
16.0
Shriramcit
2,220
5.1
HCL Tech
IT
Buy
797
1,000
25.5
Supremeind
904
4.5
Bharat Electronics
Capital Goods
Accumulate
1,280
1,414
10.5
Idfc
63
4.3
Equitas Holdings
Financials
Buy
176
235
33.4
Bayercrop
4,495
4.1
Navkar Corporation Others
Buy
194
265
36.5
More Top Picks on Pg3
Aiaeng
1,244
3.5
Key Upcoming Events
Top Losers
Price (`)
Chg (%)
Previous
Consensus
Date
Region
Event Description
Reading
Expectations
Sintex
80
(5.8)
Sep 29 US
Initial Jobless claims
252.0
260.0
Torntpower
183
(3.4)
Sep 29 US
GDP QoQ (Annualised)
1.1
1.3
Jetairways
526
(3.2)
Sep 29 Germany
Unemployment Change (000s)
(7.0)
(5.0)
Cesc
621
(2.9)
Sep 29 Euro Zone
Euro Zone Consumer Confidence
(8.2)
(8.2)
Sep 30 Germany
PMI Manufacturing
54.3
--
Justdial
443
(2.7)
As on September 27, 2016
Oct 01 UK
GDP YoY
2.2
2.2
Oct 03 China
PMI Manufacturing
50.4
50.4
More Events on Pg4
Market Outlook
September 28, 2016
News Analysis
Moody’s upgrades Tata Motors on JLR boost, strong domestic
operations
Rating agency Moody’s has upgraded the Tata Motors’ rating by a notch on
account of continued strong performance of its British arm Jaguar Land Rover (JLR)
and improvement in the company’s domestic business. Moody’s has assigned Ba1
rating to Tata Motors, up from the earlier Ba2.Although JLR accounted for around
one half of Tata Motors’ group volumes in 2015-16, it generated more than 82
per cent of group revenues and over 86 per cent of group EBITDA.
Moody’s expect that broadening product range of JLR will dominate the group’s
revenue and EBITDA. Its strengthening geographic diversity and the expected
diversification in its manufacturing footprint outside of the UK is also expected to
benefit the company. The domestic business continues to perform robustly with the
revival in the business cycle and steady launches in passenger vehicles. The
company commands more than 50 per cent market share of domestic CV industry
and with the revival in the commercial vehicle demand in India Tata Motors CV
segment will have robust demand prospects for the next 12-18 months.
RCom to trim debt by 75% in 12 months
Reliance Communications which is reeling under huge debt of over `42,000cr is
planning to shed up to 75 per cent of its debt over the next one year. Company
Chairman Anil Ambani said that the ongoing merger of MTS and Aircel with
RCom will help it reduce the debt by `20,000cr. This three-way merger will create
a formidable operator with the second largest holder of spectrum aggregating 448
MHz across the 850, 900, 1,800 and 2,100 MHz bands.
The merger, once completed, will make RCom the fourth largest telecom player
with around 180 million subscribers. RCom's asset base will become `65,000 cr
and will have a networth of `35,000cr. The merger will lead to a reduction in
RCom’s overall debt by Rs 20,000cr from its total debt of `42,651cr, and Aircel’s
debt will come down by `4,000cr from `23,436cr. RCom is also associated with
Reliance Jio and it is believed that their association has accomplished a virtual
merger between them.
Economic and Political News
Commerce Ministry wary of revoking Most Favoured Nation status for Pakistan
Monetary policy panel to meet before October 4: Das
Solid demand, milestone reforms to sustain India's growth: ADB
Corporate News
Steel companies headed for second consecutive price hike in October
NIIT Ltd acquires Bengaluru-based ed-tech startup Perceptron
Coal India's share buyback to commence on October 3
Two-wheeler sales expected to grow 10-12 per cent in FY17: ICRA
Market Outlook
September 28, 2016
Top Picks
Large Cap
Market Cap
CMP
Target
Upside
Company
Rationale
(` Cr)
(`)
(`)
(%)
To outpace battery industry growth due to better technological
Amara Raja Batteries
17,289
1,012
1,174
16.0
products leading to market share gains in both the
automotive OEM and replacement segments.
Uptick in defense capex by government when coupled with
Bharat Electronics
30,713
1,280
1,414
10.5
BELs strong market positioning, indicate that good times are
ahead for BEL.
The stock is trading at attractive valuations and is factoring all
HCL Tech
1,12,437
797
1,000
25.5
the bad news.
Back on the growth trend, expect a long term growth of 14%
Infosys
2,38,986
1,040
1,370
31.7
to be a US$20bn in FY2020.
Source: Company, Angel Research
Mid Cap
Market Cap
CMP
Target
Upside
Company
Rationale
(` Cr)
(`)
(`)
(%)
Among the top 4 players in the consumer durables segment.
Bajaj Electricals
2,753
272
306
12.4
Improved profitability backed by turn around in E&P
segment. Strong order book lends earnings visibility.
Favourable outlook for the AC industry to augur well for
Cooling products business which is out pacing the market
Blue Star
5,041
529
578
9.3
growth. EMPPAC division's profitability to improve once
operating environment turns around.
With a focus on the low and medium income (LMI) consumer
Dewan Housing Finance
8,645
296
325
9.7
segment, the company has increased its presence in tier-II &
III cities where the growth opportunity is immense.
Strong loan growth backed by diversified loan portfolio and
adequate CAR. ROE & ROA likely to remain decent as risk of
Equitas Holdings
5,909
176
235
33.4
dilution remains low. Attractive valuations considering
growth.
Expectations of above average monsoon augurs well for
Goodyear India
1,435
622
684
10.0
Goodyear India as it derives ~50% of its turnover from farm
tyre segment.
Economic recovery to have favourable impact on advertising
& circulation revenue growth. Further, the acquisition of a
Jagran Prakashan
6,269
192
225
17.3
radio business (Radio City) would also boost the company's
revenue growth.
Speedier execution and speedier sales, strong revenue
Mahindra Lifespace
1,773
432
522
20.8
visibilty in short-to-long run, attractive valuations
Massive capacity expansion along with rail advantage at ICD
Navkar Corporation
2,769
194
265
36.5
as well CFS augurs well for the company
Strong brands and distribution network would boost growth
Siyaram Silk Mills
1,217
1,298
1,469
13.2
going ahead. Stock currently trades at an inexpensive
valuation.
Market leadership in Hindi news genre and no. 2 viewership
ranking in English news genre, exit from the radio business,
TV Today Network
1,817
305
363
19.2
and anticipated growth in ad spends by corporates to benefit
the stock.
Source: Company, Angel Research
Market Outlook
September 28, 2016
Key Upcoming Events
Global economic events release calendar
Date
Time
Country
Event Description
Unit
Period
Bloomberg Data
Last Reported Estimated
Sep 29, 2016
6:00PM
US
Initial Jobless claims
Thousands
Sep 24
252.00
260.00
1:25PM
Germany
Unemployment change (000's)
Thousands
Sep
(7.00)
(5.00)
2:30PM
Euro Zone
Euro-Zone Consumer Confidence
Value
Sep F
(8.20)
(8.20)
6:00PM
US
GDP Qoq (Annualised)
% Change
2Q T
1.10
1.30
Sep 30, 2016
1:25PM
Germany
PMI Manufacturing
Value
Sep F
54.30
--
Oct 1, 2016
2:00PM
UK
GDP (YoY)
% Change
2Q F
2.20
2.20
Oct 3, 2016
6:30AM
China
PMI Manufacturing
Value
Sep
50.40
50.40
2:00PM
UK
PMI Manufacturing
Value
Sep
53.30
--
Oct 4, 2016
11:00AM
India
RBI Reverse Repo rate
%
Oct 4
6.00
--
11:00AM
India
RBI Repo rate
%
Oct 4
6.50
--
11:00AM
India
RBI Cash Reserve ratio
%
Oct 4
4.00
--
Oct 5, 2016
1:25PM
Germany
PMI Services
Value
Sep F
50.60
--
Oct 7, 2016
2:00PM
UK
Industrial Production (YoY)
% Change
Aug
2.10
--
6:00PM
US
Change in Nonfarm payrolls
Thousands
Sep
151.00
175.00
6:00PM
US
Unnemployment rate
%
Sep
4.90
4.90
Oct 10, 2016
India
Imports YoY%
% Change
Sep
(14.09)
--
5:30PM
India
Industrial Production YoY
% Change
Aug
(2.40)
--
Oct 12, 2016
India
Exports YoY%
% Change
Sep
(0.30)
--
Oct 13, 2016
China
Exports YoY%
% Change
Sep
(2.80)
--
Oct 14, 2016
US
Producer Price Index (mom)
% Change
Sep
(0.30)
--
12:00PM
India
Monthly Wholesale Prices YoY%
% Change
Sep
3.74
--
7:00AM
China
Consumer Price Index (YoY)
% Change
Sep
1.30
--
Oct 17, 2016
2:30PM
Euro Zone
Euro-Zone CPI (YoY)
%
Sep F
0.20
--
6:45PM
US
Industrial Production
%
Sep
(0.43)
--
Oct 18, 2016
6:00PM
US
Consumer price index (mom)
% Change
Sep
0.20
--
2:00PM
UK
CPI (YoY)
% Change
Sep
0.60
--
Source: Bloomberg, Angel Research
Market Outlook
September 28, 2016
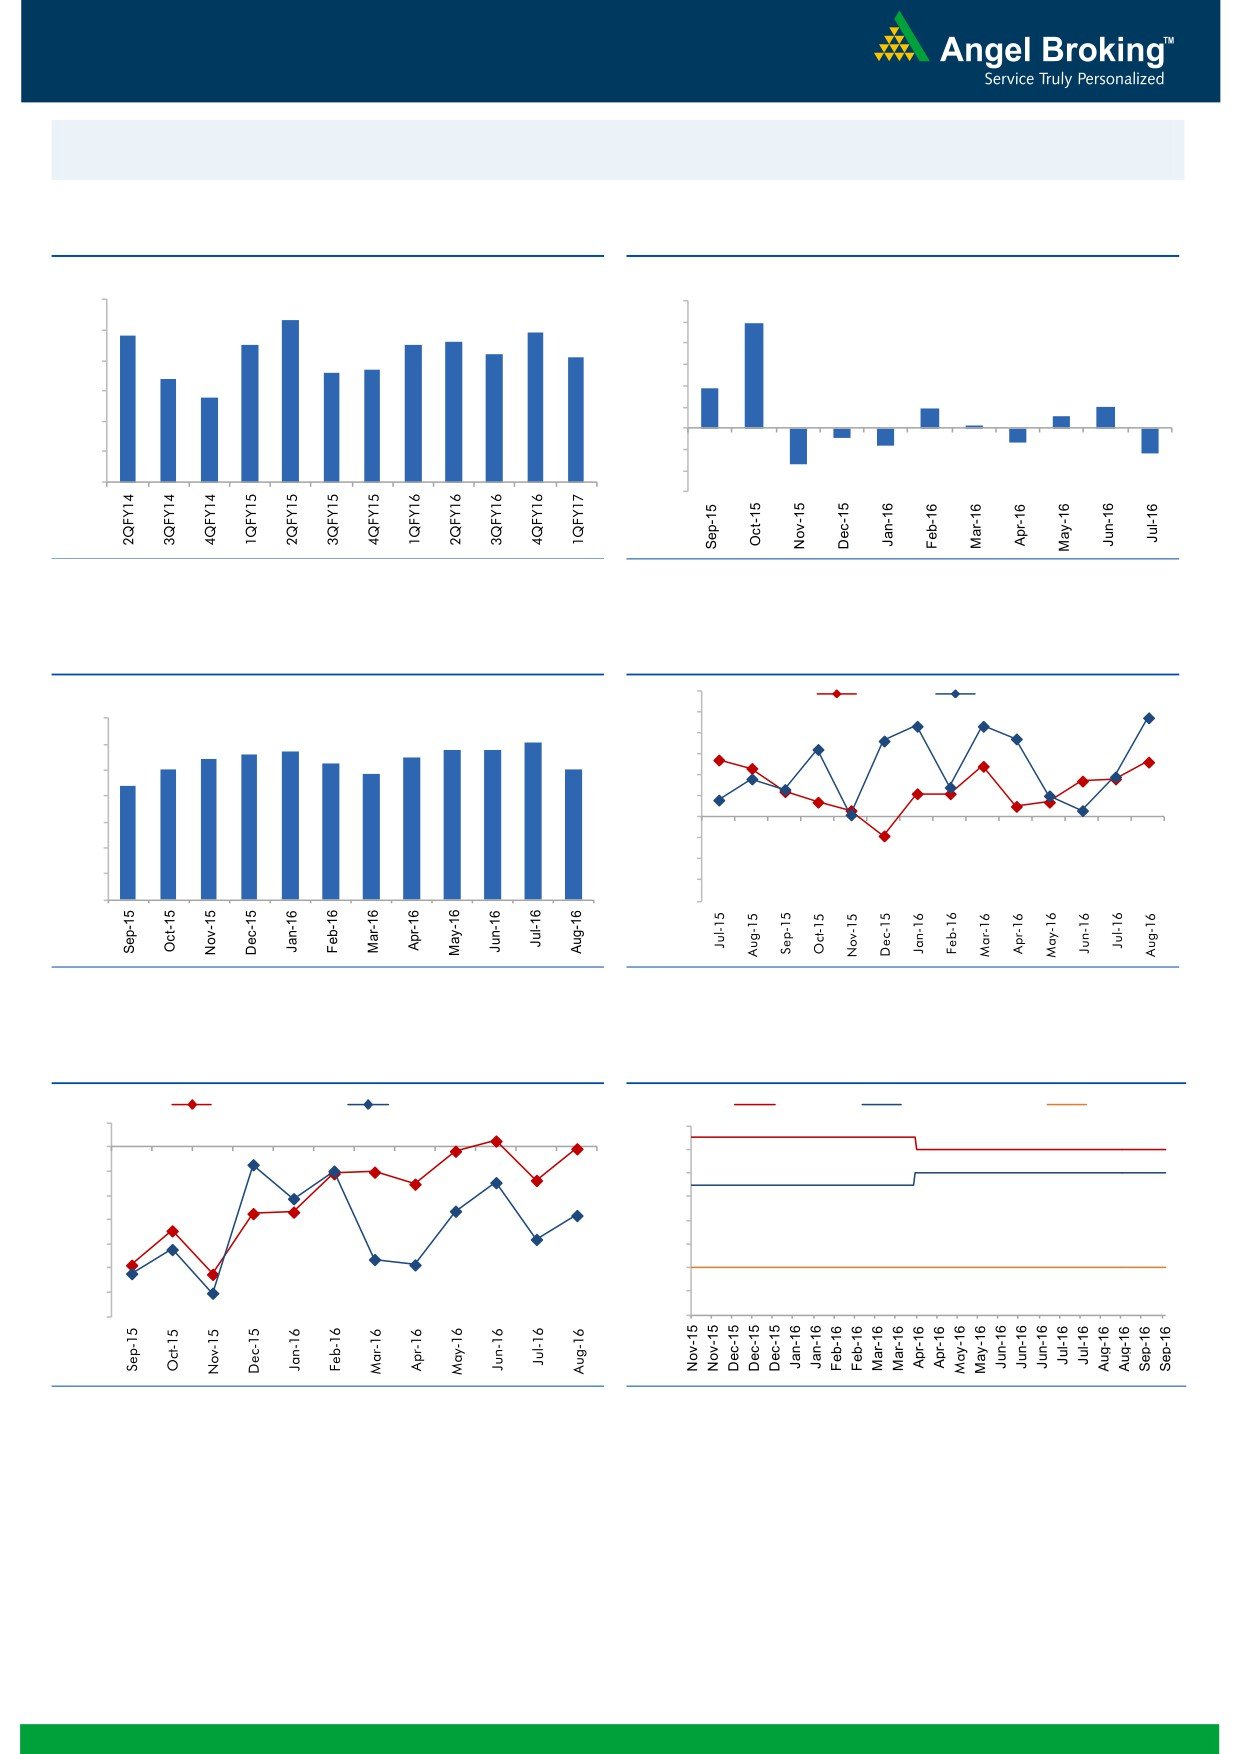
Macro watch
Exhibit 1: Quarterly GDP trends
Exhibit 2: IIP trends
(%)
(%)
9.0
12.0
8.3
9.9
7.8
7.9
8.0
7.5
7.5
7.6
10.0
7.2
7.1
8.0
6.6
6.7
7.0
6.4
6.0
3.7
5.8
6.0
4.0
1.9
2.0
1.1
2.0
0.3
5.0
-
4.0
(2.0)
(0.9)
(1.3)
(1.6)
(4.0)
(2.4)
3.0
(3.4)
(6.0)
Source: CSO, Angel Research
Source: MOSPI, Angel Research
Exhibit 3: Monthly CPI inflation trends
Exhibit 4: Manufacturing and services PMI
56.0
Mfg. PMI
Services PMI
(%)
55.0
7.0
6.1
5.7
5.8
5.8
54.0
6.0
5.4
5.6
5.5
5.0
5.3
5.1
53.0
4.8
5.0
4.4
52.0
4.0
51.0
50.0
3.0
49.0
2.0
48.0
1.0
47.0
-
46.0
Source: MOSPI, Angel Research
Source: Market, Angel Research; Note: Level above 50 indicates expansion
Exhibit 5: Exports and imports growth trends
Exhibit 6: Key policy rates
(%)
Exports yoy growth
Imports yoy growth
(%)
Repo rate
Reverse Repo rate
CRR
5.0
7.00
0.0
6.50
(5.0)
6.00
(10.0)
5.50
(15.0)
5.00
(20.0)
4.50
(25.0)
4.00
(30.0)
3.50
(35.0)
3.00
Source: Bloomberg, Angel Research
Source: RBI, Angel Research
Market Outlook
September 28, 2016
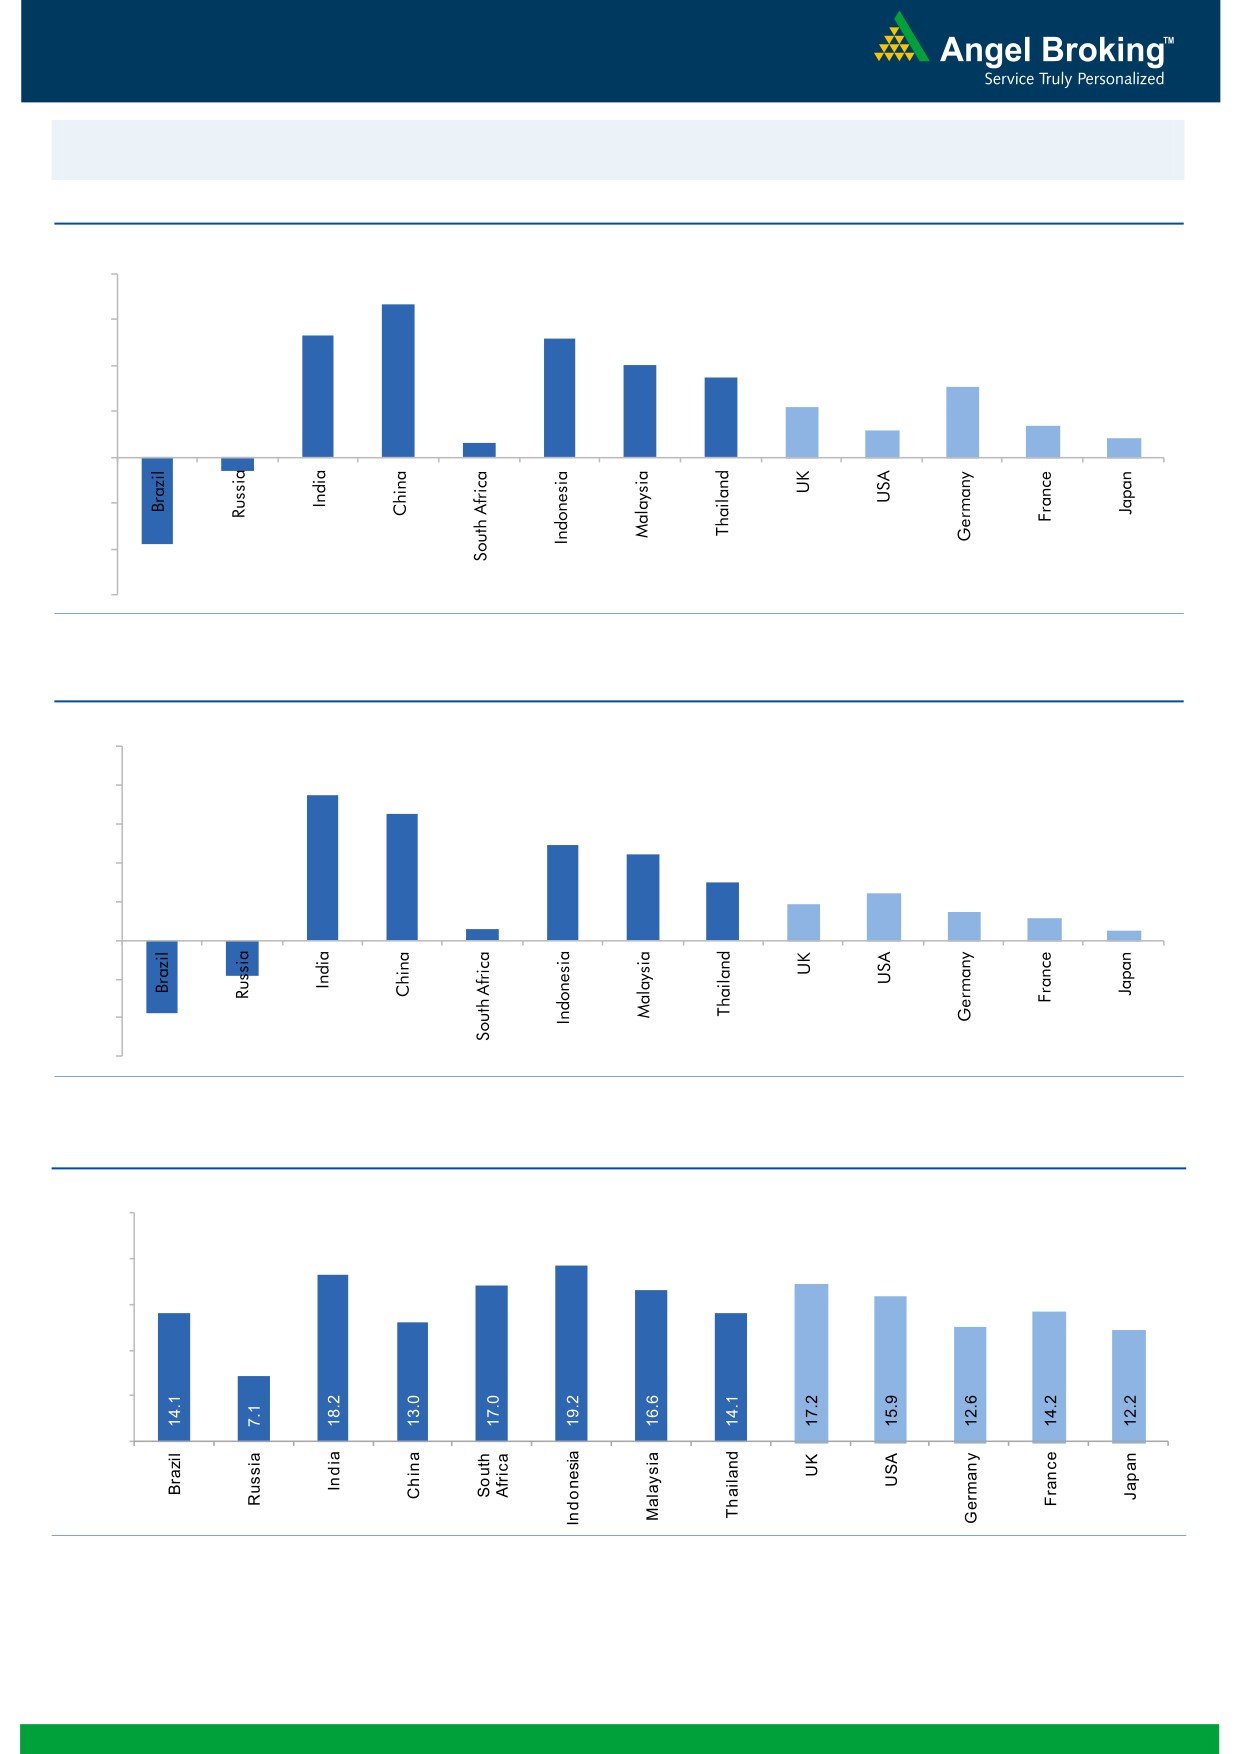
Global watch
Exhibit 1: Latest quarterly GDP Growth (%, yoy) across select developing and developed countries
(%)
8.0
6.7
6.0
5.3
0.6
5.2
4.0
3.5
4.0
3.1
2.2
1.4
2.0
1.2
0.8
-
(2.0)
(0.6)
(4.0)
(3.8)
(6.0)
Source: Bloomberg, Angel Research
Exhibit 2: 2016 GDP Growth projection by IMF (%, yoy) across select developing and developed countries
(%)
10.0
7.5
8.0
6.5
6.0
4.9
4.4
4.0
3.0
2.4
1.9
1.5
2.0
1.1
0.6
0.5
(3.8)
(1.8)
-
(2.0)
(4.0)
(6.0)
Source: IMF, Angel Research
Exhibit 3: One year forward P-E ratio across select developing and developed countries
(x)
25.0
20.0
15.0
10.0
5.0
-
Source: IMF, Angel Research
Market Outlook
September 28, 2016
Exhibit 4: Relative performance of indices across globe
Returns (%)
Country
Name of index
Closing price
1M
3M
1YR
Brazil
Bovespa
58,382
1.1
16.7
26.2
Russia
Micex
1,976
(0.9)
4.6
20.5
India
Nifty
8,706
0.6
5.3
10.2
China
Shanghai Composite
2,998
(2.6)
2.7
(3.5)
South Africa
Top 40
44,397
(5.1)
0.6
(1.3)
Mexico
Mexbol
47,732
(0.0)
6.7
13.3
Indonesia
LQ45
941
(0.5)
12.0
28.0
Malaysia
KLCI
1,665
(1.1)
1.7
(1.0)
Thailand
SET 50
948
(4.0)
3.7
5.5
USA
Dow Jones
18,228
(1.2)
6.3
13.6
UK
FTSE
6,808
(0.1)
10.9
12.3
Japan
Nikkei
16,545
0.5
2.7
(7.1)
Germany
DAX
10,361
(2.1)
7.8
9.0
France
CAC
4,399
(1.0)
4.8
(5.6)
Source: Bloomberg, Angel Research
Stock Watch
September 28, 2016
Company Name
Reco
CMP
Target
Mkt Cap
Sales ( Čcr )
OPM(%)
EPS (Č)
PER(x)
P/BV(x)
RoE(%)
EV/Sales(x)
(Č)
Price ( Č)
( Č cr )
FY17E FY18E
FY17E
FY18E
FY17E
FY18E
FY17E
FY18E
FY17E
FY18E
FY17E
FY18E
FY17E
FY18E
Agri / Agri Chemical
Rallis
Neutral
223
-
4,338
1,937
2,164
13.3
14.3
9.0
11.0
24.8
20.3
4.3
3.8
18.4
19.8
2.3
2.0
United Phosphorus
Neutral
683
-
34,645
15,176
17,604
18.5
18.5
37.4
44.6
18.3
15.3
3.6
3.0
21.4
21.2
2.4
2.0
Auto & Auto Ancillary
Ashok Leyland
Buy
81
111
23,151
22,407
26,022
10.6
10.6
5.2
6.4
15.6
12.7
3.5
3.0
23.6
24.7
1.1
0.9
Bajaj Auto
Neutral
2,871
-
83,079
25,093
27,891
19.5
19.2
143.9
162.5
20.0
17.7
5.6
4.8
30.3
29.4
3.0
2.7
Bharat Forge
Neutral
949
-
22,092
7,726
8,713
20.5
21.2
35.3
42.7
26.9
22.2
5.0
4.5
18.9
20.1
2.9
2.5
Eicher Motors
Neutral
24,643
-
66,934
16,583
20,447
17.5
18.0
598.0
745.2
41.2
33.1
14.1
10.7
41.2
38.3
3.9
3.1
Gabriel India
Neutral
118
-
1,694
1,544
1,715
9.0
9.3
5.4
6.3
21.8
18.7
4.1
3.7
18.9
19.5
1.1
0.9
Hero Motocorp
Neutral
3,451
-
68,903
31,253
35,198
15.3
15.0
172.3
192.1
20.0
18.0
7.3
6.3
38.9
37.0
2.1
1.8
Jamna Auto Industries Neutral
218
-
1,743
1,486
1,620
9.8
9.9
15.0
17.2
14.5
12.7
3.2
2.7
21.8
21.3
1.2
1.1
L G Balakrishnan & Bros Neutral
561
-
880
1,302
1,432
11.6
11.9
43.7
53.0
12.8
10.6
1.8
1.6
13.8
14.2
0.8
0.7
Mahindra and Mahindra Neutral
1,371
-
85,155
46,534
53,077
11.6
11.7
67.3
78.1
20.4
17.6
3.3
2.9
15.4
15.8
1.8
1.5
Maruti
Neutral
5,511
-
166,478
69,186
82,217
14.7
14.4
198.5
241.4
27.8
22.8
5.4
4.4
20.2
20.0
2.1
1.7
Minda Industries
Neutral
292
-
2,313
2,728
3,042
9.0
9.1
68.2
86.2
4.3
3.4
1.0
0.8
23.8
24.3
0.9
0.8
Motherson Sumi
Neutral
314
-
44,052
45,896
53,687
7.8
8.3
13.0
16.1
24.1
19.5
7.8
6.2
34.7
35.4
1.0
0.9
Rane Brake Lining
Neutral
1,227
-
972
511
562
11.3
11.5
28.1
30.9
43.7
39.7
6.7
6.1
15.3
15.0
2.0
1.9
Setco Automotive
Neutral
44
-
584
741
837
13.0
13.0
15.2
17.0
2.9
2.6
0.5
0.4
15.8
16.3
1.2
1.1
Tata Motors
Neutral
532
-
153,585
300,209
338,549
8.9
8.4
42.7
54.3
12.5
9.8
2.0
1.7
15.6
17.2
0.6
0.5
TVS Motor
Neutral
348
-
16,521
13,390
15,948
6.9
7.1
12.8
16.5
27.3
21.0
6.8
5.4
26.3
27.2
1.3
1.0
Amara Raja Batteries
Buy
1,012
1,174
17,289
5,429
6,471
17.5
17.6
35.3
43.5
28.7
23.3
6.6
5.3
25.3
24.8
3.0
2.5
Exide Industries
Neutral
189
-
16,065
7,439
8,307
15.0
15.0
8.1
9.3
23.3
20.3
3.3
2.9
14.3
16.7
1.8
1.6
Apollo Tyres
Neutral
215
-
10,954
12,877
14,504
14.3
13.9
21.4
23.0
10.0
9.4
1.6
1.4
16.4
15.2
1.0
0.9
Ceat
Neutral
1,195
-
4,834
7,524
8,624
13.0
12.7
131.1
144.3
9.1
8.3
1.7
1.4
19.8
18.6
0.7
0.6
JK Tyres
Neutral
140
-
3,170
7,455
8,056
15.0
15.0
21.8
24.5
6.4
5.7
1.3
1.1
22.8
21.3
0.6
0.5
Swaraj Engines
Neutral
1,200
-
1,490
660
810
15.2
16.4
54.5
72.8
22.0
16.5
6.9
6.2
31.5
39.2
2.1
1.7
Subros
Neutral
129
-
771
1,488
1,681
11.7
11.9
6.4
7.2
20.1
17.9
2.1
1.9
10.8
11.4
0.8
0.6
Indag Rubber
Neutral
178
-
466
286
326
19.8
16.8
11.7
13.3
15.2
13.3
2.6
2.4
17.8
17.1
1.3
1.1
Capital Goods
ACE
Neutral
46
-
453
709
814
4.1
4.6
1.4
2.1
32.7
21.8
1.4
1.3
4.4
6.0
0.8
0.7
BEML
Buy
906
1,157
3,773
3,451
4,055
6.3
9.2
31.4
57.9
28.9
15.7
1.7
1.6
6.3
10.9
1.2
1.0
Bharat Electronics
Accumulate
1,280
1,414
30,713
8,137
9,169
16.8
17.2
58.7
62.5
21.8
20.5
3.4
3.0
44.6
46.3
2.8
2.5
Stock Watch
September 28, 2016
Company Name
Reco
CMP
Target
Mkt Cap
Sales ( Čcr )
OPM(%)
EPS (Č)
PER(x)
P/BV(x)
RoE(%)
EV/Sales(x)
(Č)
Price ( Č)
( Č cr )
FY17E
FY18E
FY17E
FY18E
FY17E
FY18E
FY17E
FY18E
FY17E
FY18E
FY17E
FY18E
FY17E
FY18E
Capital Goods
Voltas
Accumulate
381
407
12,615
6,511
7,514
7.9
8.7
12.9
16.3
29.6
23.4
5.3
4.7
16.7
18.5
1.7
1.4
BGR Energy
Neutral
114
-
819
16,567
33,848
6.0
5.6
7.8
5.9
14.6
19.2
0.8
0.8
4.7
4.2
0.2
0.1
BHEL
Neutral
141
-
34,536
28,797
34,742
-
2.8
2.3
6.9
61.4
20.5
1.0
1.0
1.3
4.8
0.9
0.6
Blue Star
Accumulate
529
578
5,042
4,351
5,024
6.4
7.1
17.2
20.6
30.8
25.6
20.0
16.7
23.1
24.1
1.2
1.0
Crompton Greaves
Neutral
79
-
4,951
5,777
6,120
5.9
7.0
3.3
4.5
23.9
17.6
1.1
1.0
4.4
5.9
0.8
0.7
Greaves Cotton
Neutral
128
-
3,115
1,755
1,881
16.8
16.9
7.8
8.5
16.4
15.0
3.3
3.0
20.6
20.9
1.5
1.3
Inox Wind
Buy
209
286
4,636
5,605
6,267
15.7
16.4
24.8
30.0
8.4
7.0
2.4
1.7
25.9
24.4
0.9
0.7
KEC International
Neutral
126
-
3,243
9,294
10,186
7.9
8.1
9.9
11.9
12.7
10.6
1.9
1.6
15.6
16.3
0.6
0.5
Thermax
Neutral
865
-
10,303
5,421
5,940
7.3
7.3
25.7
30.2
33.6
28.6
4.1
3.7
12.2
13.1
1.8
1.6
VATech Wabag
Buy
551
681
3,003
3,136
3,845
8.9
9.1
26.0
35.9
21.2
15.4
2.7
2.3
13.4
15.9
0.9
0.7
Cement
ACC
Neutral
1,607
-
30,170
11,225
13,172
13.2
16.9
44.5
75.5
36.1
21.3
3.4
3.2
11.2
14.2
2.7
2.3
Ambuja Cements
Neutral
258
-
51,230
9,350
10,979
18.2
22.5
5.8
9.5
44.5
27.2
3.7
3.4
10.2
12.5
5.5
4.7
India Cements
Neutral
147
-
4,520
4,364
4,997
18.5
19.2
7.9
11.3
18.6
13.0
1.3
1.3
8.0
8.5
1.8
1.6
JK Cement
Neutral
830
-
5,803
4,398
5,173
15.5
17.5
31.2
55.5
26.6
15.0
3.2
2.8
12.0
15.5
1.9
1.6
J K Lakshmi Cement
Neutral
491
-
5,775
2,913
3,412
14.5
19.5
7.5
22.5
65.4
21.8
4.0
3.4
12.5
18.0
2.6
2.2
Orient Cement
Neutral
206
-
4,214
2,114
2,558
18.5
20.5
8.1
11.3
25.4
18.2
3.7
3.2
9.0
14.0
2.6
2.1
UltraTech Cement
Neutral
3,915
-
107,441
25,768
30,385
21.0
23.5
111.0
160.0
35.3
24.5
4.5
3.9
13.5
15.8
4.3
3.6
Construction
ITNL
Neutral
100
-
3,301
8,946
10,017
31.0
31.6
8.1
9.1
12.4
11.0
0.5
0.5
4.2
5.0
3.7
3.4
KNR Constructions
Neutral
770
-
2,164
1,385
1,673
14.7
14.0
41.2
48.5
18.7
15.9
3.5
3.0
14.9
15.2
1.6
1.4
Larsen & Toubro
Buy
1,440
1,700
134,163
67,665
77,249
10.7
11.5
57.3
71.2
25.1
20.2
2.3
2.2
12.6
14.3
2.2
1.9
Gujarat Pipavav Port
Neutral
173
-
8,356
705
788
52.2
51.7
5.0
5.6
34.6
30.9
3.4
3.1
11.2
11.2
11.5
9.8
Nagarjuna Const.
Neutral
85
-
4,737
8,842
9,775
9.1
8.8
5.3
6.4
16.1
13.3
1.3
1.2
8.2
9.1
0.7
0.6
PNC Infratech
Buy
120
143
3,082
2,350
2,904
13.1
13.2
9.0
8.8
13.4
13.7
0.5
0.4
15.9
13.9
1.4
1.2
Simplex Infra
Neutral
334
-
1,651
6,829
7,954
10.5
10.5
31.4
37.4
10.6
8.9
1.1
1.0
9.9
13.4
0.7
0.6
Power Mech Projects
Neutral
494
-
727
1,801
2,219
12.7
14.6
72.1
113.9
6.9
4.3
1.3
1.1
16.8
11.9
0.4
0.3
Sadbhav Engineering
Accumulate
282
298
4,839
3,598
4,140
10.3
10.6
9.0
11.9
31.3
23.7
3.3
2.9
9.9
11.9
1.6
1.4
NBCC
Neutral
253
-
15,183
7,428
9,549
7.9
8.6
8.2
11.0
30.9
23.0
1.5
1.2
28.2
28.7
1.8
1.3
MEP Infra
Neutral
43
-
702
1,877
1,943
30.6
29.8
3.0
4.2
14.4
10.3
7.0
4.7
0.6
0.6
1.8
1.6
SIPL
Neutral
108
-
3,809
1,036
1,252
65.5
66.2
(8.4)
(5.6)
4.1
4.6
(22.8)
(15.9)
11.9
9.9
Stock Watch
September 28, 2016
Company Name
Reco
CMP
Target
Mkt Cap
Sales ( Čcr )
OPM(%)
EPS (Č)
PER(x)
P/BV(x)
RoE(%)
EV/Sales(x)
(Č)
Price ( Č)
( Č cr )
FY17E
FY18E
FY17E
FY18E
FY17E
FY18E
FY17E
FY18E
FY17E
FY18E
FY17E
FY18E
FY17E
FY18E
Construction
Engineers India
Neutral
252
-
8,504
1,725
1,935
16.0
19.1
11.4
13.9
22.1
18.2
3.1
3.0
13.4
15.3
3.9
3.5
Financials
Axis Bank
Neutral
541
-
129,147
58,081
66,459
3.5
3.5
32.4
44.6
16.7
12.1
2.2
1.9
13.6
16.5
-
-
Bank of Baroda
Neutral
164
-
37,788
19,980
23,178
1.8
1.8
11.5
17.3
14.3
9.5
1.6
1.3
8.3
10.1
-
-
Canara Bank
Neutral
303
-
16,447
15,225
16,836
1.8
1.8
14.5
28.0
20.9
10.8
1.4
1.2
5.8
8.5
-
-
Dewan Housing Finance Accumulate
296
325
8,645
2,225
2,688
2.9
2.9
29.7
34.6
10.0
8.6
1.6
1.4
16.1
16.8
-
-
Equitas Holdings
Buy
176
235
5,909
939
1,281
11.7
11.5
5.8
8.2
30.4
21.5
2.6
2.3
10.9
11.5
-
-
Federal Bank
Neutral
72
-
12,448
9,353
10,623
2.9
2.9
4.4
5.8
16.5
12.5
1.6
1.4
9.5
11.0
-
-
HDFC
Neutral
1,418
-
224,133
11,475
13,450
3.4
3.4
45.3
52.5
31.3
27.0
6.0
5.3
20.2
20.5
-
-
HDFC Bank
Neutral
1,298
-
328,544
46,097
55,433
4.5
4.5
58.4
68.0
22.2
19.1
3.9
3.3
18.8
18.6
-
-
ICICI Bank
Neutral
261
-
151,705
39,029
45,903
3.3
3.3
16.7
16.3
15.6
16.0
1.9
1.8
10.1
12.4
-
-
LIC Housing Finance
Neutral
571
-
28,809
3,712
4,293
2.6
2.5
39.0
46.0
14.6
12.4
2.8
2.4
19.9
20.1
-
-
Punjab Natl.Bank
Neutral
140
-
29,738
23,532
23,595
2.3
2.4
6.8
12.6
20.6
11.1
3.2
2.3
3.3
6.5
-
-
RBL Bank
Accumulate
299
325
11,054
1,783
2,309
2.6
2.6
12.7
16.4
23.5
18.2
2.6
2.3
12.8
13.3
-
-
South Ind.Bank
Neutral
22
-
3,018
6,435
7,578
2.5
2.5
2.7
3.1
8.3
7.2
1.1
0.9
10.1
11.2
-
-
St Bk of India
Neutral
249
-
193,254
88,650
98,335
2.6
2.6
13.5
18.8
18.4
13.2
1.8
1.5
7.0
8.5
-
-
Union Bank
Neutral
141
-
9,724
13,450
14,925
2.3
2.3
25.5
34.5
5.6
4.1
0.8
0.7
7.5
10.2
-
-
Yes Bank
Neutral
1,246
-
52,467
8,978
11,281
3.3
3.4
74.0
90.0
16.8
13.9
3.2
2.7
17.0
17.2
-
-
FMCG
Asian Paints
Neutral
1,194
-
114,514
17,128
18,978
16.8
16.4
19.1
20.7
62.5
57.7
21.8
20.5
34.8
35.5
6.6
6.0
Britannia
Neutral
3,432
-
41,177
9,795
11,040
14.6
14.9
80.3
94.0
42.7
36.5
17.6
13.6
41.2
-
4.1
3.6
Colgate
Neutral
979
-
26,614
4,605
5,149
23.4
23.4
23.8
26.9
41.1
36.4
22.8
17.8
64.8
66.8
5.7
5.1
Dabur India
Neutral
282
-
49,608
8,315
9,405
19.8
20.7
8.1
9.2
34.8
30.7
9.7
8.0
31.6
31.0
5.6
4.9
GlaxoSmith Con*
Neutral
6,102
-
25,662
4,350
4,823
21.2
21.4
179.2
196.5
34.1
31.1
9.0
7.7
27.1
26.8
5.3
4.7
Godrej Consumer
Neutral
1,609
-
54,804
10,235
11,428
18.4
18.6
41.1
44.2
39.2
36.4
8.7
7.3
24.9
24.8
5.4
4.8
HUL
Neutral
896
-
193,895
35,252
38,495
17.6
17.4
20.4
21.9
43.9
40.9
36.1
31.6
82.2
77.3
5.3
4.9
ITC
Buy
246
283
296,701
40,059
44,439
39.0
39.2
9.1
10.1
27.0
24.4
7.4
6.5
27.2
26.5
6.9
6.2
Marico
Neutral
281
-
36,189
6,430
7,349
18.8
19.5
6.4
7.7
43.8
36.4
13.2
11.1
33.2
32.5
5.4
4.7
Nestle*
Neutral
6,487
-
62,544
10,073
11,807
20.7
21.5
124.8
154.2
52.0
42.1
21.3
19.2
34.8
36.7
6.0
5.1
Tata Global
Neutral
145
-
9,123
8,675
9,088
9.8
9.8
7.4
8.2
19.5
17.6
2.2
2.1
7.9
8.1
1.0
0.9
Procter & Gamble
Accumulate
6,899
7,369
22,395
2,939
3,342
23.2
23.0
146.2
163.7
47.2
42.1
105.7
101.3
25.3
23.5
7.2
6.2
Hygiene
Stock Watch
September 28, 2016
Company Name
Reco
CMP
Target
Mkt Cap
Sales ( Čcr )
OPM(%)
EPS (Č)
PER(x)
P/BV(x)
RoE(%)
EV/Sales(x)
(Č)
Price ( Č)
( Č cr )
FY17E FY18E
FY17E
FY18E
FY17E
FY18E
FY17E
FY18E
FY17E
FY18E
FY17E
FY18E
FY17E
FY18E
IT
HCL Tech^
Buy
797
1,000
112,437
49,242
57,168
20.5
20.5
55.7
64.1
14.3
12.4
2.9
2.2
20.3
17.9
2.1
1.7
Infosys
Buy
1,040
1,370
238,986
69,934
79,025
27.5
27.5
64.8
72.0
16.1
14.5
3.5
3.2
22.0
22.3
2.9
2.5
TCS
Buy
2,431
3,004
478,952
121,684
136,286
27.3
27.3
135.0
150.1
18.0
16.2
6.0
5.5
33.2
33.9
3.7
3.3
Tech Mahindra
Buy
448
700
43,487
30,347
33,685
17.0
17.0
37.5
41.3
12.0
10.9
2.6
2.3
21.8
20.7
1.2
1.0
Wipro
Buy
484
680
117,744
51,631
55,822
21.7
17.9
35.9
36.9
13.5
13.1
2.8
2.6
19.0
18.1
2.0
1.8
Media
D B Corp
Neutral
398
-
7,317
2,297
2,590
27.4
28.2
21.0
23.4
19.0
17.0
4.4
3.8
23.7
23.1
3.0
2.6
HT Media
Neutral
82
-
1,913
2,693
2,991
12.6
12.9
7.9
9.0
10.4
9.1
0.9
0.8
7.8
8.3
0.3
0.2
Jagran Prakashan
Buy
192
225
6,269
2,355
2,635
28.0
28.0
10.8
12.5
17.8
15.3
3.9
3.3
21.7
21.7
2.7
2.4
Sun TV Network
Neutral
496
-
19,549
2,850
3,265
70.1
71.0
26.2
30.4
18.9
16.3
4.8
4.3
24.3
25.6
6.5
5.5
Hindustan Media
Neutral
285
-
2,091
1,016
1,138
24.3
25.2
27.3
30.1
10.4
9.5
2.0
1.8
16.2
15.8
1.4
1.2
Ventures
TV Today Network
Buy
305
363
1,817
637
743
27.5
27.5
18.4
21.4
16.6
14.2
2.9
2.5
17.4
17.2
2.5
2.0
Metals & Mining
Coal India
Neutral
332
-
209,703
84,638
94,297
21.4
22.3
24.5
27.1
13.6
12.3
5.6
5.4
42.6
46.0
2.0
1.8
Hind. Zinc
Neutral
229
-
96,718
14,252
18,465
55.9
48.3
15.8
21.5
14.5
10.7
2.4
2.1
17.0
20.7
6.8
5.2
Hindalco
Neutral
150
-
30,933
107,899
112,095
7.4
8.2
9.2
13.0
16.3
11.5
0.8
0.7
4.8
6.6
0.8
0.8
JSW Steel
Neutral
1,757
-
42,477
53,201
58,779
16.1
16.2
130.6
153.7
13.5
11.4
1.8
1.6
14.0
14.4
1.6
1.4
NMDC
Neutral
106
-
42,185
6,643
7,284
44.4
47.7
7.1
7.7
15.0
13.8
1.3
1.3
8.8
9.2
4.1
3.7
SAIL
Neutral
47
-
19,556
47,528
53,738
(0.7)
2.1
(1.9)
2.6
18.2
0.5
0.5
(1.6)
3.9
1.3
1.1
Vedanta
Neutral
167
-
49,392
71,744
81,944
19.2
21.7
13.4
20.1
12.4
8.3
1.1
1.0
8.4
11.3
1.1
0.8
Tata Steel
Neutral
368
-
35,726
121,374
121,856
7.2
8.4
18.6
34.3
19.8
10.7
1.2
1.1
6.1
10.1
0.9
0.9
Oil & Gas
Cairn India
Neutral
193
-
36,138
9,127
10,632
4.3
20.6
8.8
11.7
21.9
16.5
0.7
0.7
3.3
4.2
5.4
4.5
GAIL
Neutral
373
-
47,340
56,220
65,198
9.3
10.1
27.1
33.3
13.8
11.2
1.3
1.2
9.3
10.7
1.0
0.9
ONGC
Neutral
248
-
211,748
137,222
152,563
15.0
21.8
19.5
24.1
12.7
10.3
1.1
1.0
8.5
10.1
1.8
1.6
Indian Oil Corp
Neutral
586
-
142,193
373,359
428,656
5.9
5.5
54.0
59.3
10.9
9.9
1.7
1.5
16.0
15.6
0.5
0.5
Reliance Industries
Neutral
1,110
-
360,057
301,963
358,039
12.1
12.6
87.7
101.7
12.7
10.9
1.3
1.2
10.7
11.3
1.7
1.4
Pharmaceuticals
Alembic Pharma
Neutral
675
-
12,727
3,483
4,083
20.2
21.4
24.3
30.4
27.8
22.2
6.3
5.1
25.5
25.3
3.6
3.0
Aurobindo Pharma
Neutral
858
-
50,234
15,720
18,078
23.7
23.7
41.4
47.3
20.7
18.2
5.4
4.2
29.6
26.1
3.4
3.0
Sanofi India*
Neutral
4,250
-
9,788
2,357
2,692
17.3
17.3
153.5
169.2
27.7
25.1
4.7
3.8
25.8
28.4
3.8
3.1
Cadila Healthcare
Neutral
398
-
40,694
11,126
13,148
22.0
22.0
17.1
20.0
23.3
19.9
6.0
4.7
28.8
26.6
3.7
3.0
Cipla
Sell
607
490
48,813
15,378
18,089
17.4
18.4
21.6
27.2
28.1
22.3
3.6
3.2
13.7
15.2
3.4
2.8
Stock Watch
September 28, 2016
Company Name
Reco
CMP
Target
Mkt Cap
Sales ( Čcr )
OPM(%)
EPS (Č)
PER(x)
P/BV(x)
RoE(%)
EV/Sales(x)
(Č)
Price ( Č)
( Č cr )
FY17E FY18E
FY17E
FY18E
FY17E
FY18E
FY17E
FY18E
FY17E
FY18E
FY17E
FY18E
FY17E
FY18E
Pharmaceuticals
Dr Reddy's
Neutral
3,190
-
52,853
16,043
18,119
23.1
24.7
126.0
157.8
25.3
20.2
3.7
3.2
15.7
17.1
3.3
2.8
Dishman Pharma
Sell
222
45
3,580
1,718
1,890
22.7
22.8
9.5
11.3
23.4
19.6
2.3
2.1
10.1
10.9
2.5
2.2
GSK Pharma*
Neutral
2,815
-
23,844
3,528
3,811
16.6
18.8
51.8
59.4
54.3
47.4
14.5
14.5
26.3
30.6
6.5
6.1
Indoco Remedies
Sell
332
225
3,060
1,112
1,289
18.2
18.2
13.2
15.6
25.2
21.3
4.5
3.8
19.2
19.2
2.9
2.5
Ipca labs
Neutral
598
-
7,545
3,303
3,799
15.3
15.3
17.3
19.7
34.6
30.4
3.0
2.8
9.1
9.4
2.4
2.1
Lupin
Buy
1,514
1,809
68,253
15,912
18,644
26.4
26.7
58.1
69.3
26.1
21.9
5.1
4.2
21.4
20.9
4.4
3.6
Sun Pharma
Buy
771
944
185,436
31,129
35,258
30.0
30.9
28.0
32.8
27.5
23.5
4.2
3.5
18.7
18.9
5.5
4.7
Power
Tata Power
Neutral
75
-
20,258
36,916
39,557
17.4
27.1
5.1
6.3
14.7
11.9
1.3
1.2
9.0
10.3
1.6
1.4
NTPC
Neutral
152
-
125,372
86,605
95,545
17.5
20.8
11.8
13.4
12.9
11.4
1.3
1.2
10.5
11.1
2.8
2.8
Power Grid
Neutral
176
-
92,102
25,763
29,762
74.3
73.1
14.8
17.3
11.9
10.2
1.9
1.6
16.9
17.5
7.8
7.5
Real Estate
MLIFE
Buy
432
522
1,773
1,152
1,300
22.7
24.6
29.9
35.8
14.5
12.1
1.1
1.0
7.6
8.6
2.3
1.9
Telecom
Bharti Airtel
Neutral
314
-
125,518
105,086
114,808
34.5
34.7
12.2
16.4
25.7
19.2
1.7
1.6
6.8
8.4
2.1
1.8
Idea Cellular
Neutral
80
-
28,626
40,133
43,731
37.2
37.1
6.4
6.5
12.4
12.2
1.0
1.0
8.2
7.6
1.7
1.5
zOthers
Abbott India
Neutral
4,733
-
10,057
3,153
3,583
14.1
14.4
152.2
182.7
31.1
25.9
152.7
130.4
25.6
26.1
2.9
2.5
Bajaj Electricals
Accumulate
272
306
2,753
5,099
5,805
5.6
5.9
11.4
14.6
24.0
18.7
3.2
2.8
13.4
15.1
0.5
0.5
Finolex Cables
Neutral
437
-
6,686
2,883
3,115
12.0
12.1
14.2
18.6
30.8
23.5
16.4
14.3
15.8
14.6
2.0
1.8
Goodyear India*
Accumulate
622
684
1,435
1,598
1,704
10.4
10.2
49.4
52.6
12.6
11.8
58.1
51.0
18.2
17.0
0.6
79.0
Hitachi
Neutral
1,644
-
4,469
2,081
2,433
8.8
8.9
33.4
39.9
49.2
41.2
39.7
33.1
22.1
21.4
2.1
1.8
Jyothy Laboratories
Neutral
342
-
6,185
1,440
2,052
11.5
13.0
8.5
10.0
40.2
34.2
9.7
9.0
18.6
19.3
4.6
3.2
Page Industries
Neutral
14,884
-
16,601
2,450
3,124
20.1
17.6
299.0
310.0
49.8
48.0
331.5
253.0
47.1
87.5
6.8
5.4
Relaxo Footwears
Neutral
460
-
5,520
2,085
2,469
9.2
8.2
7.6
8.0
60.8
57.9
23.6
20.1
17.9
18.8
2.7
2.3
Siyaram Silk Mills
Accumulate
1,298
1,469
1,217
1,799
2,040
11.6
11.7
104.9
122.4
12.4
10.6
2.0
1.7
16.4
16.4
0.9
0.8
Styrolution ABS India*
Neutral
595
-
1,046
1,440
1,537
9.2
9.0
40.6
42.6
14.7
14.0
37.4
34.0
12.3
11.6
0.7
0.6
TVS Srichakra
Neutral
3,168
-
2,426
2,304
2,614
13.7
13.8
231.1
266.6
13.7
11.9
356.0
280.3
33.9
29.3
1.1
0.9
HSIL
Neutral
340
-
2,457
2,384
2,515
15.8
16.3
15.3
19.4
22.2
17.5
22.1
19.0
7.8
9.3
1.2
1.1
Kirloskar Engines India
Neutral
329
-
4,759
2,554
2,800
9.9
10.0
10.5
12.1
31.3
27.2
13.1
12.4
10.7
11.7
1.5
1.3
Ltd
M M Forgings
Neutral
419
-
506
546
608
20.4
20.7
41.3
48.7
10.2
8.6
57.5
50.8
16.6
17.0
0.8
0.7
Banco Products (India)
Neutral
214
-
1,532
1,353
1,471
12.3
12.4
14.5
16.3
14.8
13.1
20.4
18.4
14.5
14.6
1.1
115.2
Competent Automobiles Neutral
194
-
119
1,137
1,256
3.1
2.7
28.0
23.6
6.9
8.2
37.4
33.8
14.3
11.5
0.1
0.1
Stock Watch
September 28, 2016
Company Name
Reco
CMP
Target
Mkt Cap
Sales ( Čcr )
OPM(%)
EPS (Č)
PER(x)
P/BV(x)
RoE(%)
EV/Sales(x)
(Č)
Price ( Č)
( Č cr )
FY17E
FY18E
FY17E
FY18E
FY17E
FY18E
FY17E
FY18E
FY17E
FY18E
FY17E
FY18E
FY17E
FY18E
zOthers
Nilkamal
Neutral
1,336
-
1,994
1,995
2,165
10.7
10.4
69.8
80.6
19.1
16.6
76.3
66.3
16.6
16.5
1.0
0.9
Visaka Industries
Neutral
196
-
311
1,051
1,138
10.3
10.4
21.0
23.1
9.3
8.5
25.1
23.5
9.0
9.2
0.6
0.5
Transport Corporation of
Neutral
191
-
1,462
2,671
2,911
8.5
8.8
13.9
15.7
13.8
12.2
1.9
1.7
13.7
13.8
0.7
0.6
India
Elecon Engineering
Neutral
61
-
665
1,482
1,660
13.7
14.5
3.9
5.8
15.6
10.5
3.7
3.4
7.8
10.9
0.8
0.7
Surya Roshni
Neutral
230
-
1,009
3,342
3,625
7.8
7.5
17.3
19.8
13.3
11.7
25.3
20.3
10.5
10.8
0.6
0.5
MT Educare
Neutral
130
-
519
366
417
17.7
18.2
9.4
10.8
13.9
12.1
3.1
2.7
22.2
22.3
1.3
1.1
Radico Khaitan
Neutral
121
-
1,603
1,659
1,802
13.0
13.2
6.3
7.4
19.0
16.3
1.6
1.5
8.6
9.3
1.4
1.3
Garware Wall Ropes
Neutral
525
-
1,149
873
938
12.9
13.1
30.9
34.9
17.0
15.0
2.7
2.3
15.7
15.2
1.2
1.1
Wonderla Holidays
Neutral
387
-
2,187
287
355
38.0
40.0
11.3
14.2
34.3
27.3
4.9
4.3
21.4
23.9
7.3
5.9
Linc Pen & Plastics
Neutral
270
-
399
382
420
9.3
9.5
13.5
15.7
20.1
17.2
3.4
3.0
17.1
17.3
1.1
1.0
The Byke Hospitality
Neutral
163
-
654
287
384
20.5
20.5
7.6
10.7
21.5
15.2
4.5
3.6
20.7
23.5
2.3
1.7
Interglobe Aviation
Neutral
925
-
33,319
21,122
26,005
14.5
27.6
110.7
132.1
8.4
7.0
50.0
35.7
168.5
201.1
1.6
1.2
Coffee Day Enterprises
Neutral
225
-
4,631
2,964
3,260
20.5
21.2
4.7
8.0
-
28.1
2.6
2.4
5.5
8.5
2.0
1.8
Ltd
Navneet Education
Neutral
100
-
2,388
1,062
1,147
24.0
24.0
6.1
6.6
16.5
15.1
3.4
3.0
20.6
19.8
2.3
2.2
Navkar Corporation
Buy
194
265
2,769
408
612
42.9
42.3
6.8
11.5
28.7
16.9
2.0
1.8
6.9
10.5
7.7
5.1
UFO Moviez
Neutral
488
-
1,346
619
685
33.2
33.4
30.0
34.9
16.3
14.0
2.3
1.9
13.8
13.9
1.9
1.5
VRL Logistics
Neutral
297
-
2,706
1,902
2,119
16.7
16.6
14.6
16.8
20.4
17.6
4.5
3.9
21.9
22.2
1.5
1.3
Team Lease Serv.
Neutral
1,063
-
1,817
3,229
4,001
1.5
1.8
22.8
32.8
46.7
32.4
5.0
4.3
10.7
13.4
0.5
0.4
S H Kelkar & Co.
Neutral
310
-
4,477
1,036
1,160
15.1
15.0
6.1
7.2
50.7
43.1
5.4
5.0
10.7
11.5
4.2
3.7
Quick Heal
Neutral
229
-
1,601
408
495
27.3
27.0
7.7
8.8
29.5
26.0
2.7
2.8
9.3
10.6
3.1
2.5
Narayana Hrudaya
Neutral
333
-
6,814
1,873
2,166
11.5
11.7
2.6
4.0
126.1
84.1
7.7
7.0
6.1
8.3
3.7
3.2
Manpasand Bever.
Neutral
740
-
3,706
836
1,087
19.6
19.4
16.9
23.8
43.8
31.1
5.3
4.6
12.0
14.8
4.2
3.1
Parag Milk Foods
Neutral
304
-
2,554
1,919
2,231
9.3
9.6
9.5
12.9
32.2
23.5
5.0
4.1
15.5
17.5
1.5
1.3
Mirza International
Buy
93
113
1,119
1,024
1,148
18.0
18.0
6.9
8.0
13.5
11.6
2.3
1.9
16.6
16.2
1.3
1.1
Source: Company, Angel Research; Note: *December year end; #September year end; &October year end; Price as on September 27, 2016
Market Outlook
September 28, 2016
Research Team Tel: 022 - 39357800
DISCLAIMER
Angel Broking Private Limited (hereinafter referred to as “Angel”) is a registered Member of National Stock Exchange of India
Limited,Bombay Stock Exchange Limited and Metropolitan Stock Exchange Limited. It is also registered as a Depository Participant with
CDSL and Portfolio Manager with SEBI. It also has registration with AMFI as a Mutual Fund Distributor. Angel Broking Private Limited is a
registered entity with SEBI for Research Analyst in terms of SEBI (Research Analyst) Regulations, 2014 vide registration number
INH000000164. Angel or its associates has not been debarred/ suspended by SEBI or any other regulatory authority for accessing
/dealing in securities Market. Angel or its associates/analyst has not received any compensation / managed or
co-managed public offering of securities of the company covered by Analyst during the past twelve months.
This document is solely for the personal information of the recipient, and must not be singularly used as the basis of any investment
decision. Nothing in this document should be construed as investment or financial advice. Each recipient of this document should make
such investigations as they deem necessary to arrive at an independent evaluation of an investment in the securities of the companies
referred to in this document (including the merits and risks involved), and should consult their own advisors to determine the merits and
risks of such an investment.
Reports based on technical and derivative analysis center on studying charts of a stock's price movement, outstanding positions and
trading volume, as opposed to focusing on a company's fundamentals and, as such, may not match with a report on a company's
fundamentals. Investors are advised to refer the Fundamental and Technical Research Reports available on our website to evaluate the
contrary view, if any.
The information in this document has been printed on the basis of publicly available information, internal data and other reliable
sources believed to be true, but we do not represent that it is accurate or complete and it should not be relied on as such, as this
document is for general guidance only. Angel Broking Pvt. Limited or any of its affiliates/ group companies shall not be in any way
responsible for any loss or damage that may arise to any person from any inadvertent error in the information contained in this report.
Angel Broking Pvt. Limited has not independently verified all the information contained within this document. Accordingly, we cannot
testify, nor make any representation or warranty, express or implied, to the accuracy, contents or data contained within this document.
While Angel Broking Pvt. Limited endeavors to update on a reasonable basis the information discussed in this material, there may be
regulatory, compliance, or other reasons that prevent us from doing so.
This document is being supplied to you solely for your information, and its contents, information or data may not be reproduced,
redistributed or passed on, directly or indirectly.
Neither Angel Broking Pvt. Limited, nor its directors, employees or affiliates shall be liable for any loss or damage that may arise from
or in connection with the use of this information.